It has been a sputtering start for capital markets thus far in 2024. The performance of the headline benchmark S&P 500 has been bumpy at best in moving between marginal gains and losses so far in January. But returns have been less forgiving underneath the surface, with U.S. mid-caps and U.S. small caps lower by more then -3% and -5%, respectively. And asset class diversification benefits have also been elusive as of late, with bonds also lower by more than -1% so far in 2024. Given this already slow beginning to the New Year, how should investors set their expectations for the weeks ahead?
Pullback overdue. An important point to emphasize from the jump is that these broadly based retreats should not come as a surprise to investors, as they are overdue in many respects. Following a difficult stretch through the late summer and early fall, asset classes across the board took off like a rocket starting at the end of October through the end of the year. U.S. stocks skyrocketed more than +15% higher and bonds added +7%. These are monster moves to the upside for a calendar year much less a two-month period of time over November and December. As a result, the start of the new calendar year has provided investors with as good a reason as any to whip the foam off the top of the portfolio mug.
In short, what we have seen so far in 2024 is a healthy correction for a rationally functioning market that can be attributed fundamentally to investors getting way, way, way, way, waaaaay too far ahead of themselves with Fed interest rate cut expectations coming into 2024 and needing to rein it in a bit. And we should not be surprised to see some further downside in the weeks ahead before markets find their footing and reload for their next move higher.

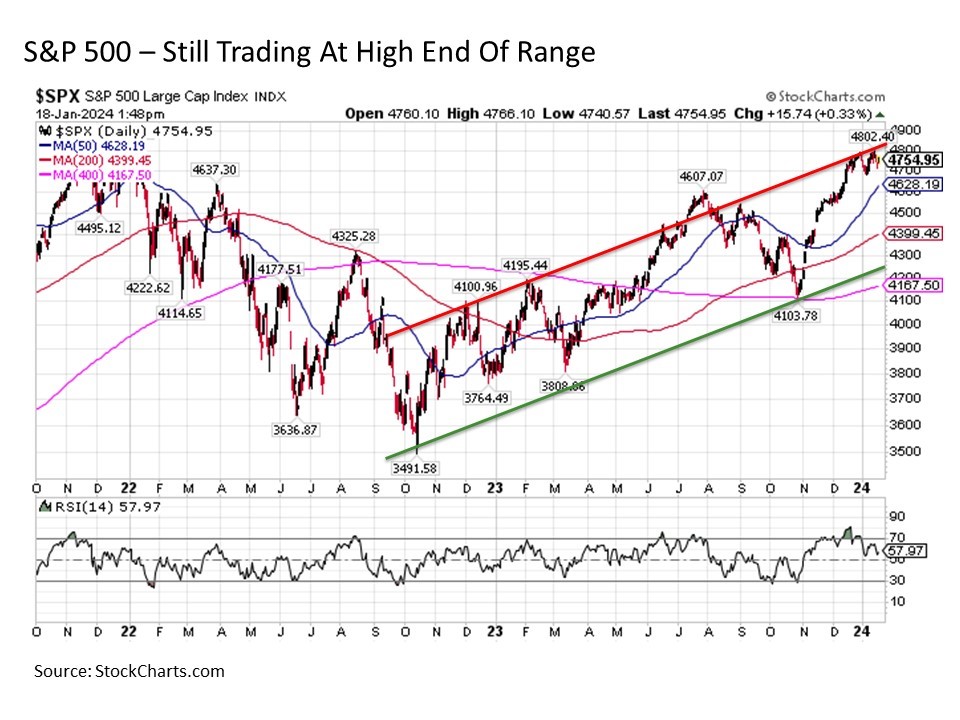
Managing expectations. Let’s start with the S&P 500, which is trading in the 4750 range today and despite the choppy start to the year continues to trade at the high end of its trading range dating back to its October 2022 lows. As a result, we could see this headline benchmark fall back by more than -10% to below 4300 in the coming weeks (the green upward sloping line in the chart above), and the current uptrend in the market would still be intact. Other logical landing points for U.S. large caps to find their footing and rally include the 4630 range (50-day moving average, or blue line in the chart above) and around 4400 (200-day moving average, or red line in the chart above). An S&P 500 falling to any of these levels would be reasonable if not healthy for markets and could be viewed by long-term investors as potential points of interest to consider increasing large cap allocations.
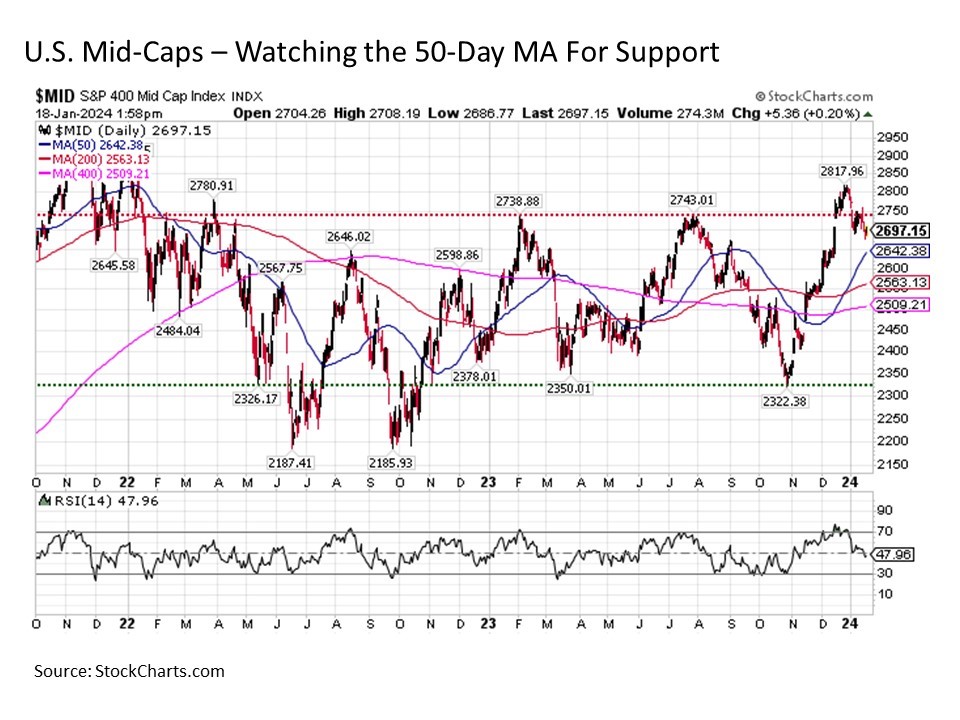
For U.S. mid-caps and U.S. small caps, the story is a bit more complex. Mid-caps and small caps did not enjoy the same gains notched by large caps in 2023, as it has been more of a back-and-forth market for these categories since the October 2022 bottom. Mid-caps have been thrashing sideways, while small caps have been trending lower. For U.S. mid-caps, holding the 50-day moving average in the chart below will be key. A break below this level leaves open the potential for mid-caps to fall all the way back to their late October lows.

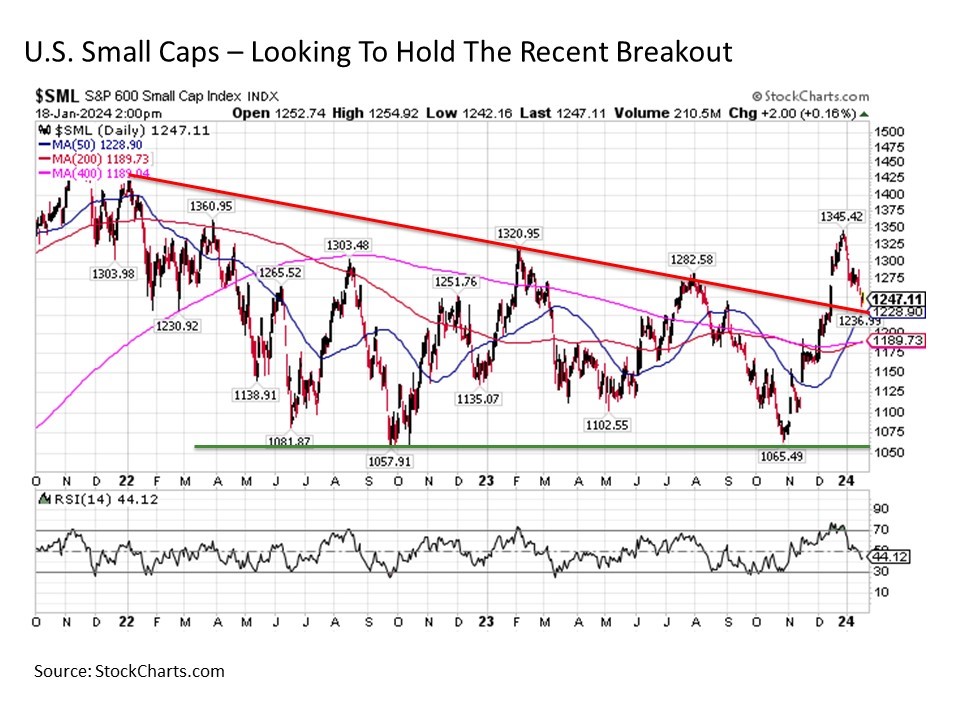
The same can be said for small caps, which posted an impressive breakout through downward sloping resistance dating back to the early 2022 market peaks. Holding this breakout that is also supported by its 50-day MA will be key in keeping small caps moving in the right direction in the weeks ahead.

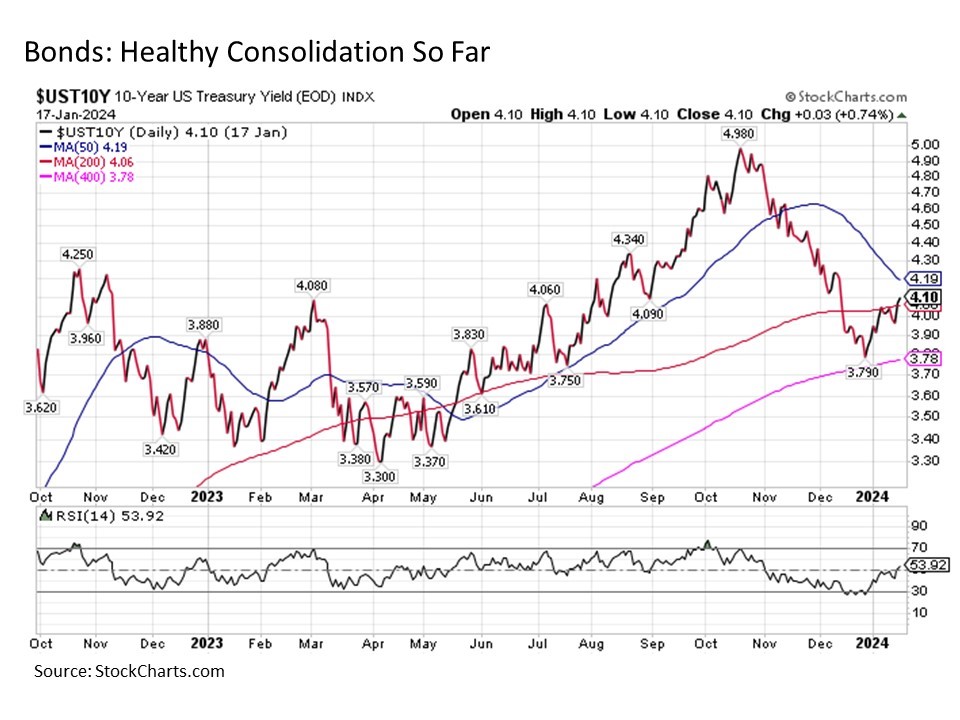
As for bonds, watching the 10-year U.S. Treasury yield will be a key barometer. The drop in this benchmark yield in the last two months of 2023 was stunning (bond prices rise as yields fall, so this drop in yields was a great thing for bond investors). After reaching below 3.80% in recent weeks, we have seen the 10-Year U.S. Treasury yield climb its way back above 4%. Much like stocks, this is a healthy consolidation of recent gains. And as long as the 10-year yield can hold in the 4.06% to 4.19% range in the days and weeks ahead, the recent downtrend in 10-year Treasury yields (and uptrend in bond prices) remains intact.

Bottom line. Capital markets do not rise or fall in a straight line. So while capital markets have stumbled out of the gates so far in 2024, any declines remain a healthy pullback following a tremendous rally at the end of last year in a rationally functioning market. As a result, recent uptrends remain intact, but key levels remain worth watching in the days and weeks ahead to determine whether the recent pullback may be subsiding or have further to go.
Disclosure: I/we have no stock, option or similar derivative position in any of the companies mentioned, and no plans to initiate any such positions within the next 72 hours. I wrote this article myself, and it expresses my own opinions. I am not receiving compensation for it. I have no business relationship with any company whose stock is mentioned in this article. Investment advice offered through Great Valley Advisor Group (GVA), a Registered Investment Advisor. I am solely an investment advisor representative of Great Valley Advisor Group, and not affiliated with LPL Financial. Any opinions or views expressed by me are not those of LPL Financial. This is not intended to be used as tax or legal advice. All performance referenced is historical and is no guarantee of future results. All indices are unmanaged and may not be invested into directly. Please consult a tax or legal professional for specific information and advice.
Compliance Tracking #: 529837-1
